-
Type:
Improvement
-
Resolution: Unresolved
-
Priority:
 Normal
-
None
-
Affects Version/s: None
-
Component/s: Back-end
-
None
The Musicbrainz dumps are currently compressed using bzip2 with a level of 7 (it seems). It has decent compression ratios but is incredibly slow to decompress, especially single-threaded, which is something i've run into quite a lot with my MeB tooling. This led me to investigating whether an alternative algorithm could be used, ideally one that is strictly better (for some set of characteristics), that the dumps could use instead.
I've run benchmarks with different compression levels and threadedness for bzip2, zstd, and xz. I didn't test single-threaded compression as 1. I'm assuming this use-case doesn't matter for MBS, as it's already specifically using multi-encoded bzip2 streams which implies it's compressed in parallel, and 2. that would make this excruciatingly slow benchmark take even longer (total runtime was already around 3 days)
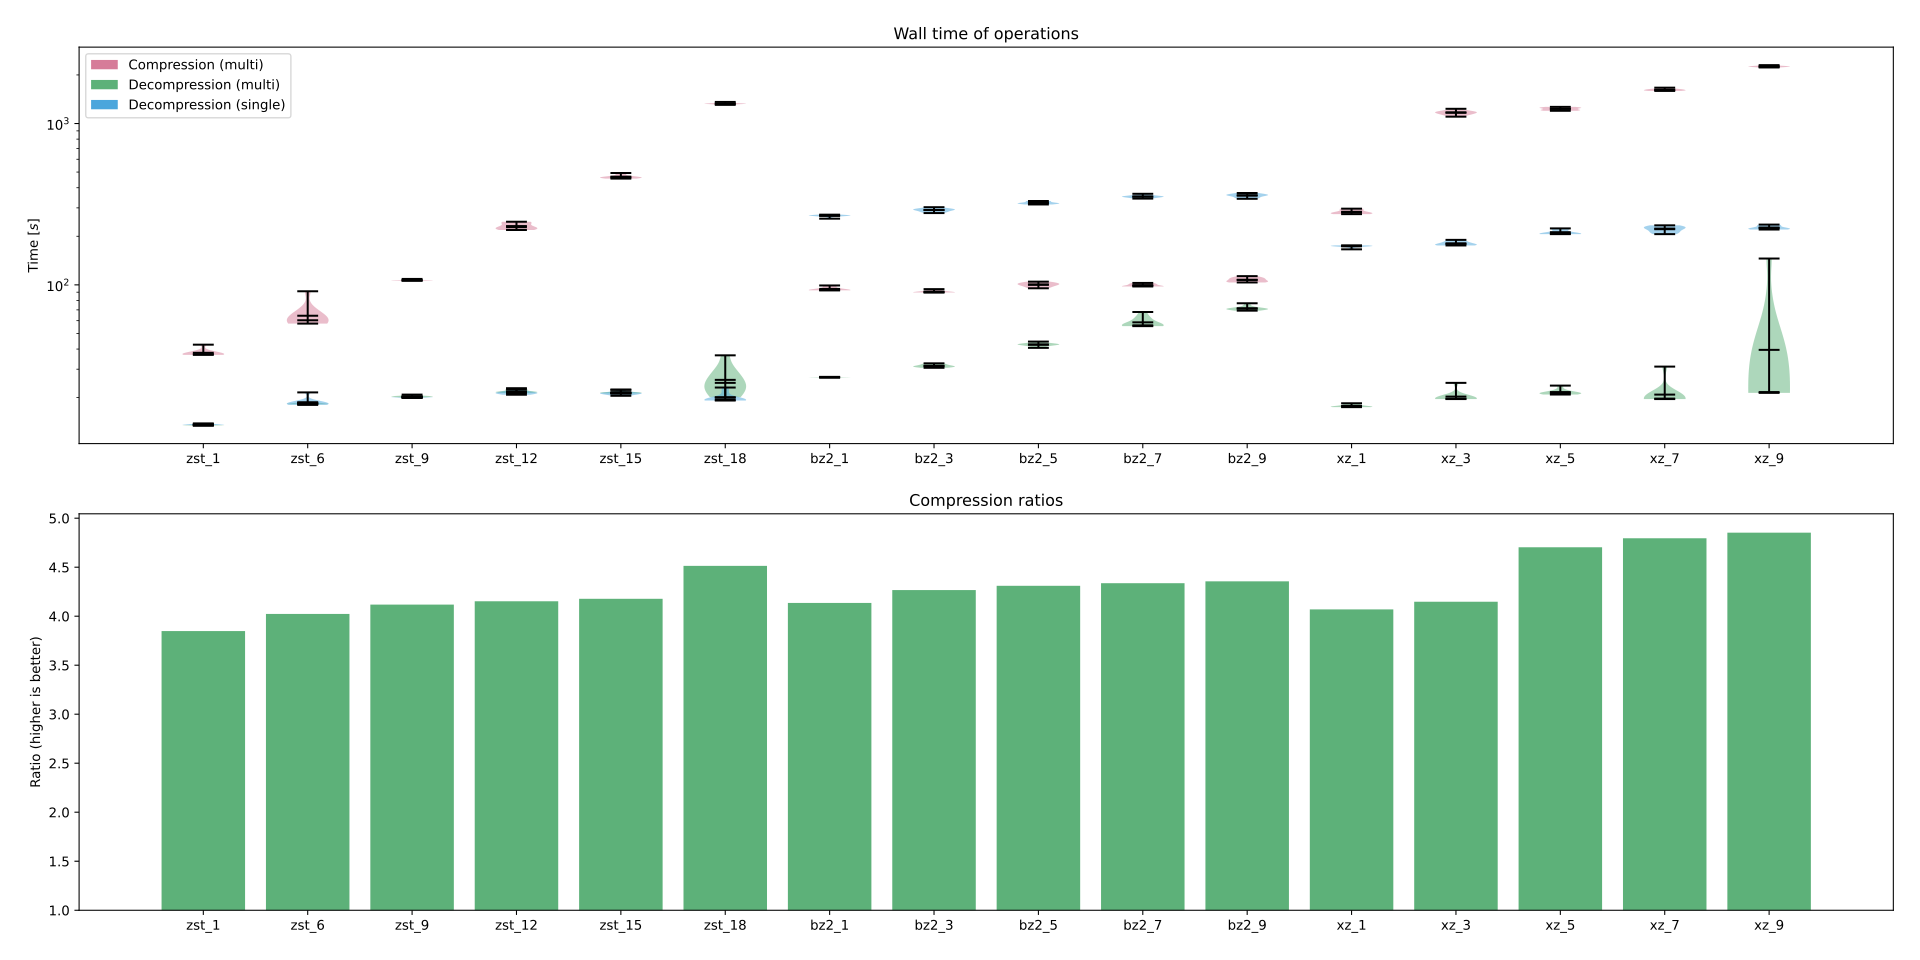
Here's the plot I've generated. Each column has 3 stacked violin plots showing the time it took for compression, decompression multi-threaded, and decompression single-threaded for a single algorithm at some level. Note that the scale is logarithmic.
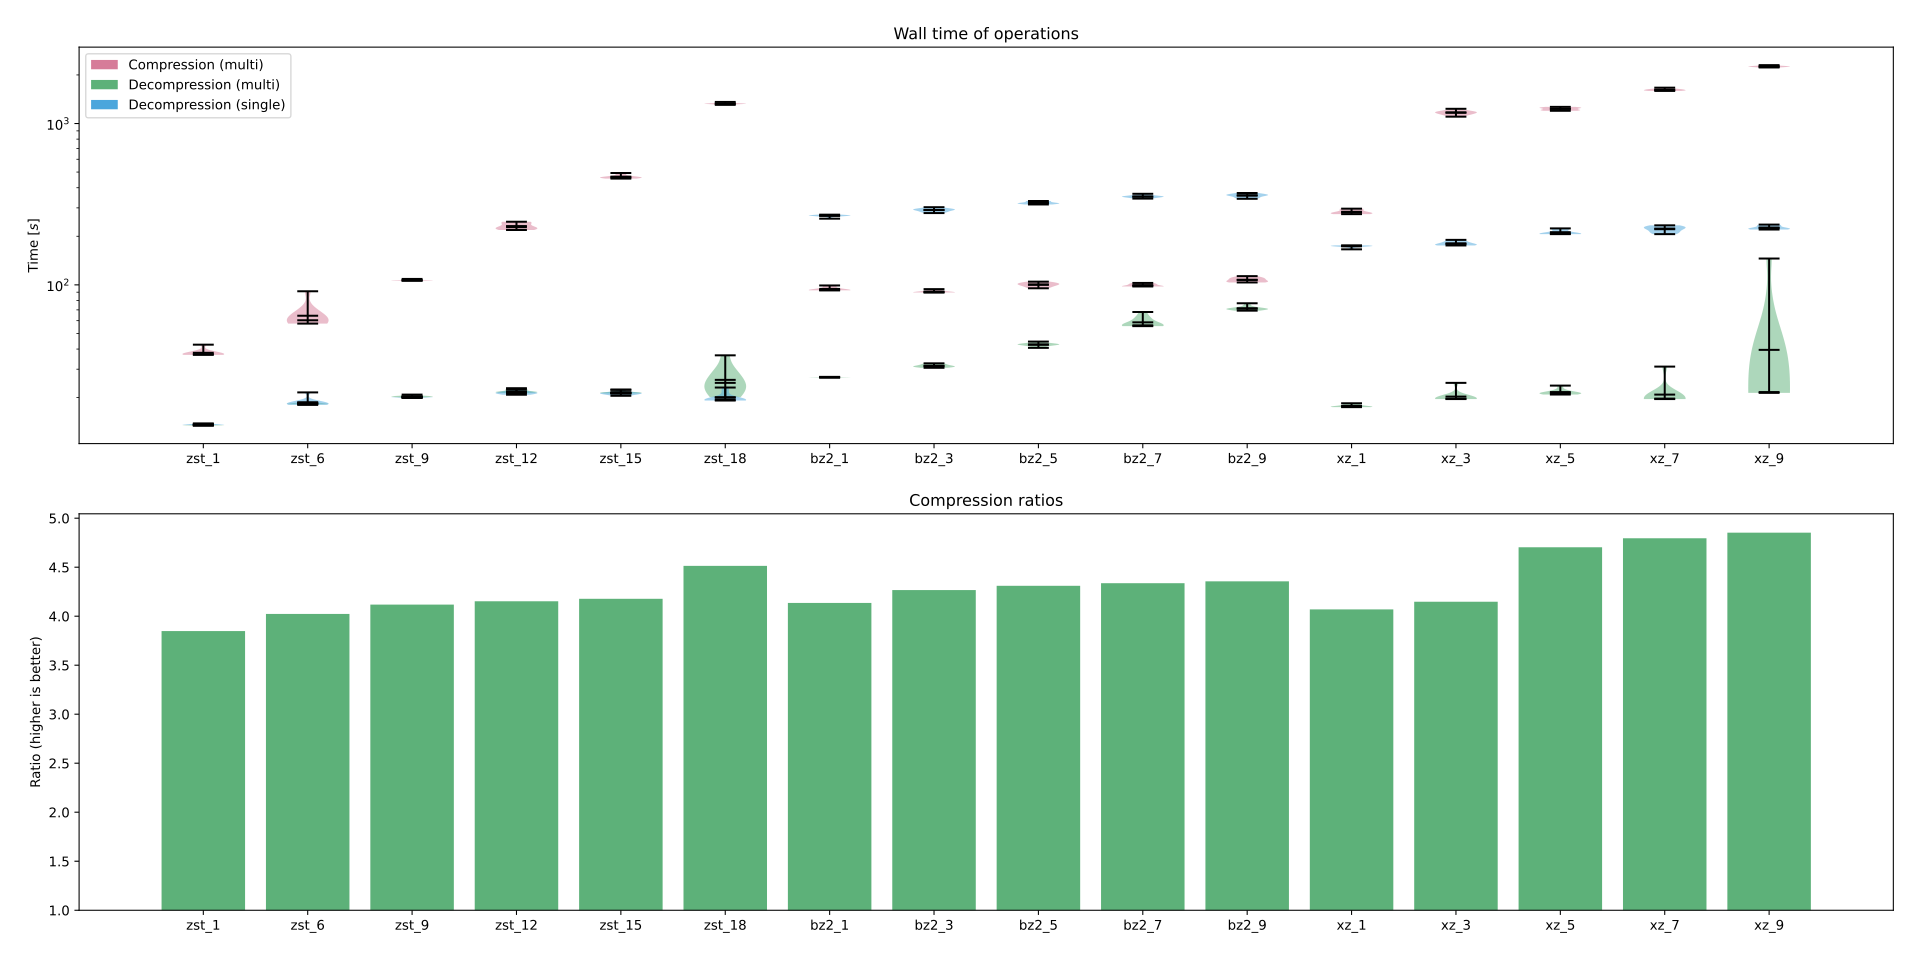
Given this I'd personally prefer zstd as it decompresses single-threaded at non-snail speeds, but it seems there unfortunately is no one clear winner; zstd can match the compression time and nearly ratio as well at level 9 with significantly better decompression speeds, but it was slightly slower and the ratio was a tad worse as well. For zstd to beat bzip2 it has to compress for much longer, but does also beat the best setting bzip2 has. Alternatively if MeB greatly favors compression time then the lower zstd levels may also suffice, in that they achieve comparable ratios (bzip2 level 7 at 4.3; zstd level 6 at 4.0) in much less time (bzip2 at 100s; zstd at 60s).
Regardless of what is chosen, I'd very much like to note how the single-threaded decompression managed to be slower than compression for some of these algorithms, which i think really goes to show how much of an impact this can have.
An additional concern is that even if this were coordinated with the next schema change, it'd probably be a good idea to allow a gradual transition which means that for some period of time MeB would reap none of the benefits yet have to store twice as much dump data and use twice as much processing power for compression.
This ticket is mainly about dumps but replication packets may be worth mentioning as well though they're much less of an issue given their size.
See also existing discussion on Matrix: https://matrix.to/#/!hyuEWFORfWYLZitABm:chatbrainz.org/$3gfdmFUsocUdmmHHjvjw7vlSHBqveFyFYsNJJQqGroo?via=chatbrainz.org&via=matrix.org&via=kanp.ai
technical details
actually running the benchmarks was very crude. i just set up a quick shell script to run a bunch of hyperfine benchmarks and left my laptop running till it completed. nothing else of significance was running in the background. each benchmark was ran 10 times with 1 warmup run.
#!/usr/bin/env nix-shell
#!nix-shell -i bash -p bash coreutils fd hyperfine zstd lbzip2 xz

file="data.tar"    # origin was `mbdump.tar.bz2` from dump 20260919-002047
threads="$(nproc)" # this was 16 for my machine

function zstd_compress { echo "zstd --stdout --force --keep --compress --threads=${2:-$threads} -$1 $file > tests/zstd_$1"; }
function zstd_decompress { echo "zstd --stdout --force --keep --decompress --threads=${2:-$threads} tests/zstd_$1 > /dev/null"; }

function lbzip2_compress { echo "lbzip2 --stdout --force --keep --compress -n ${2:-$threads} -$1 $file > tests/lbzip2_$1"; }
function lbzip2_decompress { echo "lbzip2 --stdout --force --keep --decompress -n ${2:-$threads} tests/lbzip2_$1 > /dev/null"; }

function xz_compress { echo "xz --stdout --force --keep --compress --threads=${2:-$threads} -$1 $file > tests/xz_$1"; }
function xz_decompress { echo "xz --stdout --force --keep --decompress --threads=${2:-$threads} tests/xz_$1 > /dev/null"; }

# test multi-threaded compression and both multi- and single-threaded decompression
rm -rf tests && mkdir -p tests
time hyperfine --warmup=1 --export-json stats.json -- \
  "$(zstd_compress 1)" "$(zstd_decompress 1)" "$(zstd_decompress 1 1)" \
  "$(zstd_compress 6)" "$(zstd_decompress 6)" "$(zstd_decompress 6 1)" \
  "$(zstd_compress 9)" "$(zstd_decompress 9)" "$(zstd_decompress 9 1)" \
  "$(zstd_compress 12)" "$(zstd_decompress 12)" "$(zstd_decompress 12 1)" \
  "$(zstd_compress 15)" "$(zstd_decompress 15)" "$(zstd_decompress 15 1)" \
  "$(zstd_compress 18)" "$(zstd_decompress 18)" "$(zstd_decompress 18 1)" \
  "$(lbzip2_compress 1)" "$(lbzip2_decompress 1)" "$(lbzip2_decompress 1 1)" \
  "$(lbzip2_compress 3)" "$(lbzip2_decompress 3)" "$(lbzip2_decompress 3 1)" \
  "$(lbzip2_compress 5)" "$(lbzip2_decompress 5)" "$(lbzip2_decompress 5 1)" \
  "$(lbzip2_compress 7)" "$(lbzip2_decompress 7)" "$(lbzip2_decompress 7 1)" \
  "$(lbzip2_compress 9)" "$(lbzip2_decompress 9)" "$(lbzip2_decompress 9 1)" \
  "$(xz_compress 1)" "$(xz_decompress 1)" "$(xz_decompress 1 1)" \
  "$(xz_compress 3)" "$(xz_decompress 3)" "$(xz_decompress 3 1)" \
  "$(xz_compress 5)" "$(xz_decompress 5)" "$(xz_decompress 5 1)" \
  "$(xz_compress 7)" "$(xz_decompress 7)" "$(xz_decompress 7 1)" \
  "$(xz_compress 9)" "$(xz_decompress 9)" "$(xz_decompress 9 1)"

wc --bytes --total=never "$file" | tee sizes.tsv
fd . tests --type file --print0 | wc --bytes --total=never --files0-from=- | tee -a sizes.tsv
processing
simple matplotlib to generate the violin plot and bar plot. leaving this here as 1. might be worth generating different plots, and 2. running this locally allows exploring interactively. i find that helps quite a bit with comparing. i've attached the `sizes.tsv` and `stats.json` files.
#!/usr/bin/env python3

import json
import re
import shlex
from itertools import groupby
from pathlib import Path

import matplotlib.pyplot as plt
from matplotlib.patches import Patch

outfile = "plot.svg"


def get_level(command: str) -> int:
    algorithm = shlex.split(command)[0]
    # match `algo_level` in file name either written to or read from
    return int(
        next(
            map(
                lambda match: match.groups(),
                re.finditer(rf"{algorithm}_(\d+)", command),
            )
        )[0]
    )


def get_threadedness(command: str) -> int:
    algorithm = shlex.split(command)[0]
    pattern = {
        "zstd": r"--threads=(\d+)",
        "xz": r"--threads=(\d+)",
        "lbzip2": r"-n (\d+)",
    }[algorithm]
    return int(
        next(
            map(
                lambda match: match.groups(),
                re.finditer(pattern, command),
            )
        )[0]
    )


def group_key(result) -> str:
    command = result["command"]
    algorithm = shlex.split(command)[0]
    level = get_level(command)
    # must use filename for command, e.g. `zstd_18`
    return f"{algorithm}_{level}"


stats = None
sizes = None

with open("stats.json") as file:
    stats = json.load(file)
with open("sizes.tsv") as file:
    sizes = {
        Path(key).name: int(value)
        for value, key in (line.strip().split(" ") for line in file)
    }

if stats is None or sizes is None:
    print("unable to load results or sizes")
    exit(1)

base_size = sizes["data.tar"]

labels = []
size_data = []
ratio_data = []
compress_data = []
decompress_multi_data = []
decompress_single_data = []

for group, results in groupby(stats["results"], group_key):
    compress = next(filter(lambda result: "--compress" in result["command"], results))
    decompress_multi = next(
        filter(
            lambda result: (
                "--decompress" in result["command"]
                and get_threadedness(result["command"]) != 1
            ),
            results,
        )
    )
    decompress_single = next(
        filter(
            lambda result: (
                "--decompress" in result["command"]
                and get_threadedness(result["command"]) == 1
            ),
            results,
        )
    )

    # use alternative names when label hard to read (e.g. `lbzip2_3` -> bz2_3`
    [algorithm, level] = group.split("_")
    pretty_algo = {
        "lbzip2": "bz2",
        "zstd": "zst",
    }.get(algorithm) or algorithm
    labels.append(f"{pretty_algo}_{level}")

    size_data.append(sizes[group])
    ratio_data.append(base_size / sizes[group])
    compress_data.append(compress["times"])
    decompress_multi_data.append(decompress_multi["times"])
    decompress_single_data.append(decompress_single["times"])

fig, (ax1, ax2) = plt.subplots(nrows=2, ncols=1, figsize=(20, 10), sharex=True)

# violin plot of time
ax1.set_title("Wall time of operations")
ax1.set_ylabel("Time [$s$]")
ax1.set_xticks(range(len(labels)))
ax1.set_xticklabels(labels)

ax1.set_yscale("log")

# violion plot axis; need same configuration but just have slightly different data
properties = [
    (compress_data, "Compression (multi)", "#d67c99"),
    (decompress_multi_data, "Decompression (multi)", "#5db179"),
    (decompress_single_data, "Decompression (single)", "#4ba6dc"),
]
for data, label, color in properties:
    parts = ax1.violinplot(
        data,
        positions=range(len(labels)),
        linecolor="black",
        widths=0.4,
        showmeans=True,
        showmedians=True,
    )
    for body in parts["bodies"]:
        body.set_facecolor(color)
        body.set_alpha(0.5)

handles = [Patch(facecolor=color, label=label) for _, label, color in properties]
ax1.legend(handles=handles)
ax1.tick_params(labelbottom=True)


# ratios
ax2.set_title("Compression ratios")
ax2.set_ylabel("Ratio (higher is better)")
ax2.set_xticks(range(len(labels)))
ax2.set_xticklabels(labels)
ax2.bar(
    labels,
    ratio_data,
    color="#5db179",
    bottom=1.0,
)
ax2.tick_params(labelbottom=True)

fig.tight_layout(pad=2)
if outfile is not None:
    fig.savefig(outfile)
else:
    plt.show()
benchmarking system
Relevant output from `neowofetch --json`;
{
    "OS": "NixOS 26.11.20260913.ef34387 (Zokor) x86_64",
    "Host": "Laptop 16 (AMD Ryzen 7040 Series) A9",
    "Kernel": "6.18.45-xanmod1",
    "CPU": "AMD Ryzen 9 7940HS w/ Radeon 780M Graphics (16) @ 4.0GHz",
    "Memory": "60.63 GiB"
}